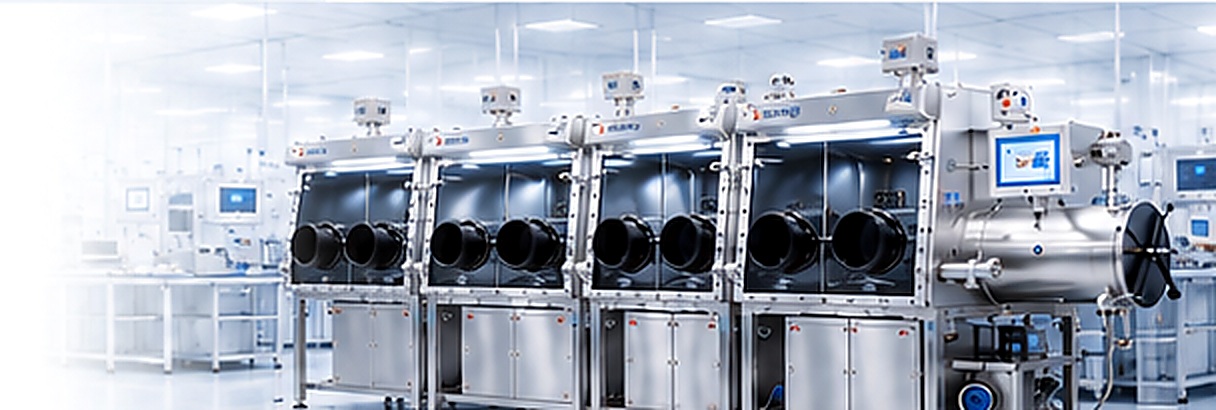
Bring lithium foil, a perovskite precursor, or an air-sensitive catalyst into a working glove box and the analyzers begin telling a story. Oxygen and moisture readings climb, then drift back down. Sometimes they return to baseline within minutes; sometimes the numbers hover above baseline for hours, and the operator starts to suspect the purification column, the sensors, or the box itself. In most cases a slow return is not one failure but the sum of ordinary effects: how much air entered with the load, how much water desorbed from surfaces, how fast the loop circulates, whether the purification material is still active, and where the analyzers sample.
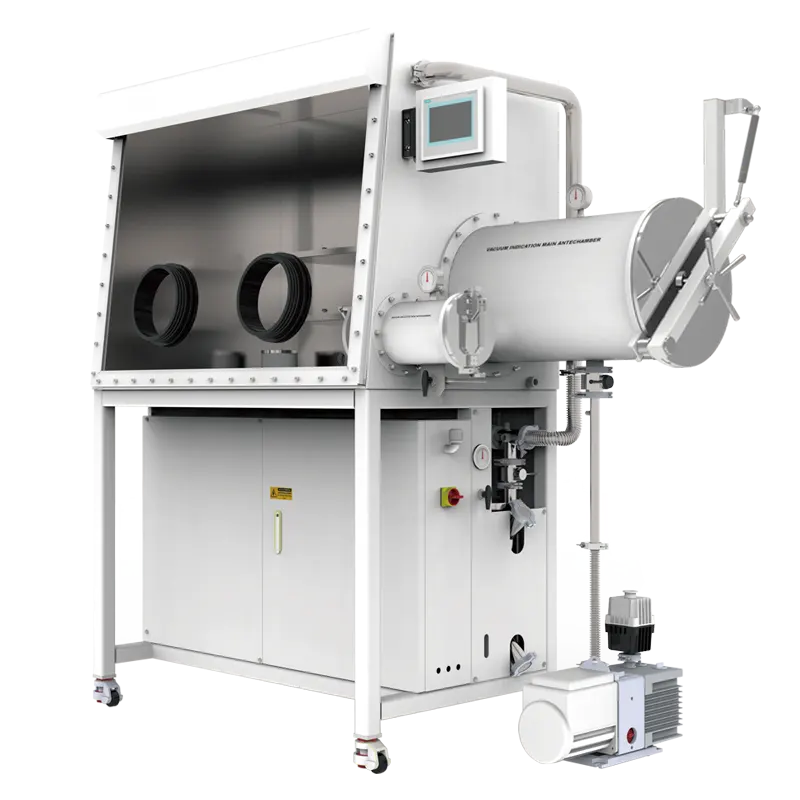
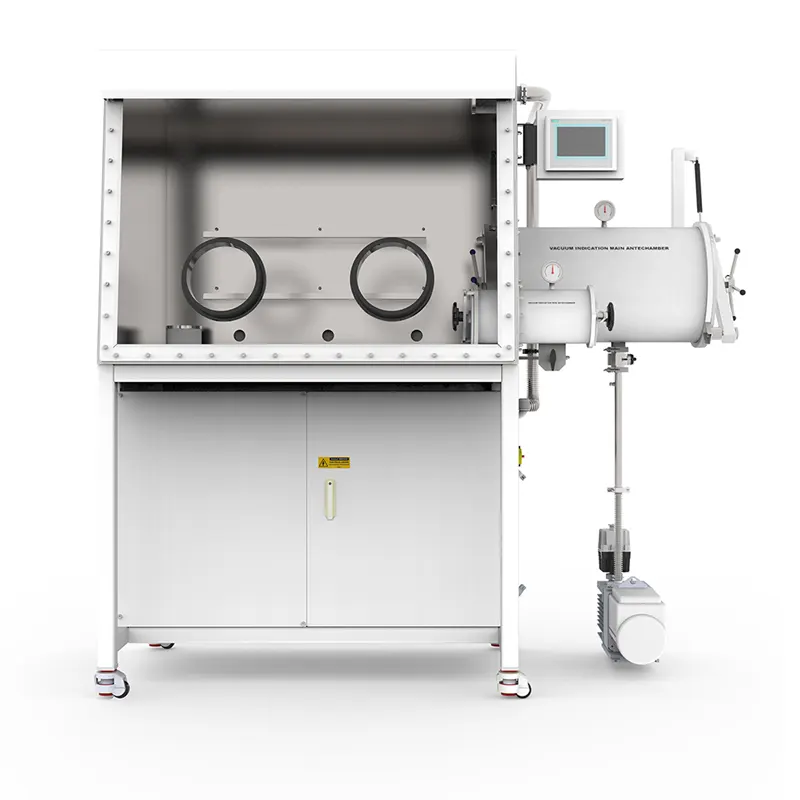
A single-station single-sided glove box with a gas purification system is compact, and that compactness shapes both its strengths and its recovery behaviour. The working volume is small, so a small, dry load disturbs it less in absolute terms; the same small volume means a large or wet load has proportionally more impact. Working out which mechanism dominates your own recovery curve is what turns a confusing reading into an actionable one.
What a Recovery Curve Is Really Telling You
A recovery curve is the sum of two overlapping processes. The first is dilution and displacement: gas carrying air, water vapour or oxygen is pushed out of the working volume and replaced by gas that has already passed through the purification loop. The second is removal: water and oxygen molecules are captured at the purification material while the loop keeps circulating. Early in the curve, dilution dominates; later, capture dominates. The shape of the tail therefore says more about the purification loop and the surfaces inside the box than about the disturbance itself.
Fast rise, fast fall
When readings spike and settle within a short interval, the disturbance was small and mostly gaseous. A sealed container that was evacuated and refilled before entry, a dry sample, a glove change performed with the port sealed — these events add little water to the atmosphere. The loop handles them almost immediately, and the curve falls steeply. This pattern is a useful baseline: it shows what your system looks like when nothing is desorbing.
Fast rise, slow fall
A steep climb followed by a long, flattening tail usually points to a reservoir rather than a leak. Porous powders, fibrous insulation, cardboard, paper labels, polymer bags, gloves and machined surfaces all hold adsorbed water. As the box atmosphere dries, that water leaves the surfaces and enters the gas phase; the loop removes it and the surface releases more. The result is a slow, self-limiting decay. Higher circulation does not eliminate it — only time, heat, or keeping wet materials out of the box does. Ask whether the load was genuinely dry before entry, and whether it was pumped or purged long enough for its own surfaces to give up water.
Slow recovery that never quite returns
When readings settle at a new, higher level instead of returning, the loop is reaching equilibrium with a continuous source. Candidates include a small, persistent leak at a glove port, a valve, a KF interface or a feedthrough; outgassing from a newly installed polymer component; a purification column that is partially spent; or a bypass path that is not fully closing. The ratio between the two readings narrows the search. A moisture-only drift suggests a hygroscopic source such as a wet glove or a water-bearing material, while oxygen and moisture rising together more often indicates air ingress, because air carries both. Neither pattern is proof on its own.
How a Closed-Loop Purification System Removes Water and Oxygen
A purification system is a loop, not a filter bed set into a wall. Gas leaves the working volume, passes through a blower, travels through one or more purification columns where moisture is adsorbed and oxygen is bound chemically, and returns to the box. The loop is closed: it is not normally vented to atmosphere during operation, and it does not consume working gas at the rate a purge-only enclosure would. That is the fundamental difference between a purification glove box and a box that is merely sealed and refilled.
Three gas streams with three different jobs
Keep three streams distinct. Working gas is the atmosphere inside the box, typically nitrogen or argon, circulating continuously through the loop. Control gas drives valves and pneumatic functions; it must be dry and of suitable quality, because any water it carries becomes water the purification material must remove. Regeneration gas is used when the purification material is reactivated, following the manufacturer's documented procedure, with the working volume isolated or bypassed as that procedure requires. Confusing the three leads to two common errors: feeding the box with wet or dirty control gas, and assuming regeneration restores the loop without any isolation of the working volume.
Why circulation and column condition dominate the tail
Two variables set the decay rate once dilution is finished. The first is volumetric circulation through the purification material. If flow is restricted — a loaded filter, a partly closed valve, a kinked hose, a blower running below its intended duty — the loop processes less gas per hour and the tail stretches. The second is the capacity and condition of the purification material. A column near saturation still pulls readings down at first, because the freshest part of the bed is doing the work, but recovery becomes progressively slower and the baseline creeps upward. Because both effects look similar on a trend chart, log regeneration history and any change in loop flow alongside the water and oxygen readings, so a lost column capacity can be distinguished from a circulation problem.
Where the Water and Oxygen Come From During a Transfer
Almost every recovery problem traces back to what entered the box and how. The sample is rarely the whole story; packaging, containers, tools and the transfer path all contribute.
The load itself
Mass alone is a poor predictor; surface area, porosity and hygroscopicity matter more. A kilogram of dense foil may contribute less water than a few grams of high-surface-area powder, and a sealed vial of anhydrous solvent can be less troublesome than the paper label stuck to it. Powders handled in ambient air carry adsorbed water on every particle surface, and the finer the powder, the larger the total surface and the more water is available to desorb. Porous parts — crucibles, felt, foam, filter media, insulation — behave similarly. Where the process allows it, pre-drying, sealing in a vacuum bag, or a longer antechamber cycle reduces how much water ever reaches the working volume.
The antechamber
The antechamber is the interface between ambient air and the controlled atmosphere, and its operation has an outsized effect. Each evacuation and refill cycle replaces part of the chamber atmosphere with working gas, but no finite number of cycles removes everything: the residual after each cycle is a fixed fraction of what was present before, so the chamber, the load and its packaging approach the box atmosphere asymptotically. Practical consequences follow. A large chamber holding a large load, or a load with awkward surfaces, needs more cycles to reach the same residual as a small chamber with a smooth sample. Materials that trap gas — bags, foam, hollow parts — release it slowly, so the effective residual is higher than the chamber pressure alone suggests. A chamber cycled quickly, without a pause that lets trapped gas escape, delivers more air per transfer than the cycle count implies.
Gloves, ports and seals
Gloves are the largest elastomeric surface in most boxes, and elastomers both permeate and desorb. Ambient humidity migrates through glove material over time, at a rate that depends on the polymer, its thickness and the humidity gradient. Gloves also hold water from handling and cleaning, and a freshly fitted glove can raise moisture readings for a while. Port O-rings, door seals and window gaskets sit on the same boundary and fail in the same quiet way — a small, persistent ingress rather than an obvious leak. Feedthroughs, KF connections, valve seats and filter housings add more potential paths. When oxygen and moisture rise together during idle periods, with no transfer in progress, the boundary is the first place to inspect.
Reading the Analyzers Without Fooling Yourself
The instruments that report water and oxygen are part of the system's behaviour, not an independent referee. Trace moisture analyzers have their own response time, drift and calibration needs, and an oxygen sensor's reading depends on where it samples and how gas reaches it. Before treating a slow recovery as a system fault, confirm that the analyzer is reporting the box rather than its own equilibration.
Resolution is not accuracy
A display with fine resolution invites over-interpretation. Resolution is the smallest change an instrument can display; accuracy is how close the displayed value is to the true value; response time is how long the sensor takes to follow a real change. A sensor can resolve a small difference while carrying a larger offset, and it can show a reassuringly flat line simply because it responds slowly. Calibration interval, reference standards and the age of the sensing element therefore matter as much as the number on the screen. If a moisture reading and an oxygen reading move in ways that are hard to reconcile, check calibration records before adjusting the box.
Where the sample is taken
Sample point location changes what the analyzer sees. A sensor on the return line from the purification column reads gas that has just been cleaned and will always look better than the working volume, especially during a disturbance. A sensor in a quiet corner may see a stagnant pocket that lags behind the bulk atmosphere. Two boxes with identical loops can therefore produce different-looking curves simply because their analyzers are plumbed differently. When comparing runs, or comparing a system against a specification, note the sample point, the flow through the sensor cell, and whether a filter or restrictor sits upstream — a clogged sample filter is a classic cause of a reading that responds sluggishly to real changes.
Particle Control Is Not Moisture Control
Work with powders, and any process that generates dust, raises a separate question: particles. A HEPA filter cartridge addresses that question and only that question. It captures particulate matter from the circulating gas stream; it does not remove water vapour, it does not remove oxygen, and it does not substitute for the purification column or for solvent adsorption media. Treating a particulate filter as an atmosphere-control device is one of the more persistent misconceptions in glove box operation.
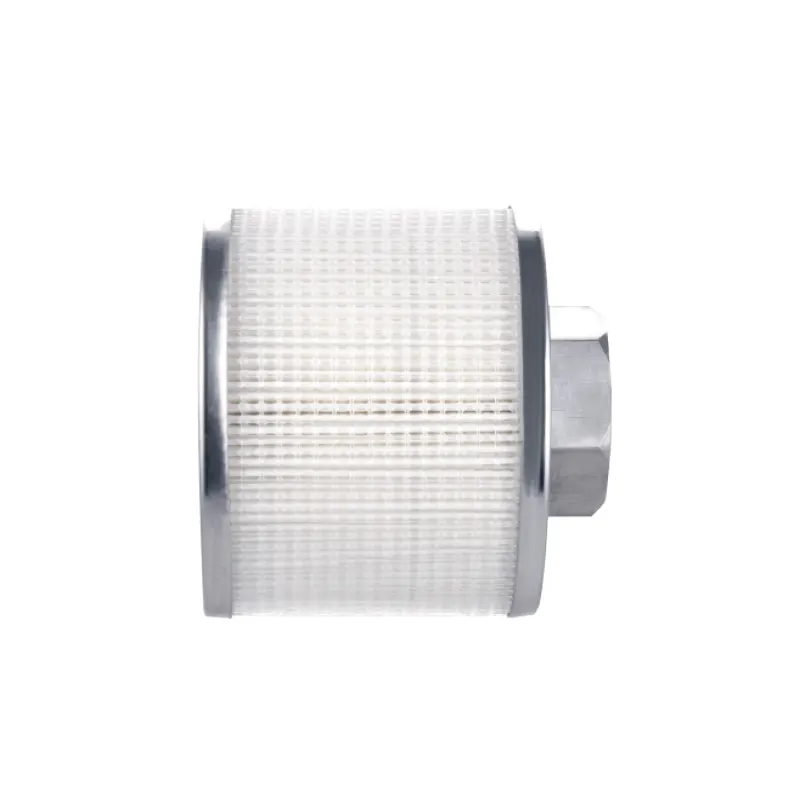
Where the cartridge does earn its place is in protecting the loop and the work. Powder handling inside the box can load the blower and the purification bed with fines if nothing intercepts them upstream; a filter element placed appropriately in the circulation path keeps that particulate burden away from components that are difficult to clean. It also reduces the chance that airborne particles settle onto a sample or a sensor window. Two practical cautions follow. First, a filter adds pressure drop to the loop, and pressure drop reduces circulation — the same variable that governs the tail of a recovery curve. Filter selection and placement therefore interact with atmosphere performance, and a heavily loaded element can quietly slow recovery. Second, filter media can hold moisture, particularly after exposure to ambient air during installation; a new element should be brought in through the antechamber and allowed to equilibrate rather than treated as though it were dry.
Solvent vapour is a third category, and it is handled by adsorption media rather than by the purification column or a particulate filter. A process that evaporates solvent inside the box loads the atmosphere with organic vapour that water and oxygen purification materials are not designed to capture, and organic vapour can also interfere with some sensor readings and with elastomer life. That is a separate design conversation from particulate control, and it is worth having before a solvent-heavy process is scaled up inside a small working volume.
Matching Configuration to the Work
Configuration decisions made at purchase determine which recovery problems are even possible. A single-station box with one working side suits an operator who works alone, keeps loads modest and values a small, quick-recovering volume. Multi-station or double-sided arrangements trade that responsiveness for shared workspace and the ability to pass work between operators without a transfer through ambient air.
What a single-station, single-sided box is good at
A single-station, single-sided purification glove box has one set of glove ports on one face and one working position. Its working volume is smaller than a multi-station counterpart's, so the same volume of intruded air produces a larger immediate excursion but is also processed by the loop more quickly, because the loop's throughput is spread over less gas. For research work with small samples, frequent short transfers and a single operator, this trade is usually favourable. The limits appear as the workload grows: two people cannot work comfortably at one station, large or awkward loads must be split into several transfers, and every extra transfer is another antechamber cycle and another disturbance. If a process routinely needs simultaneous work, or loads are large and frequent, the small box will spend more of its time recovering than working — a signal to consider a larger or multi-station system rather than to push the small one harder.
Antechamber sizing and load discipline
The antechamber is where configuration meets practice. A chamber sized for routine loads, with a volume matched to what is actually transferred, is easier to cycle to a low residual than a deliberately oversized one. Loads that fit loosely, with room for gas to move, equilibrate faster than tightly packed loads. Standardising a cycle protocol — a defined number of evacuation and refill steps with a defined pause between them — turns transfer from a variable into a documented step and makes any change in recovery behaviour meaningful rather than anecdotal. Transferring a sample in a sealed, purged container is often faster overall than cycling a large chamber around an unprotected load.
Before You Conclude the System Is Underperforming
Slow recovery is usually a process and configuration question before it is a hardware question. The indicators below help separate common causes. Read them as prompts for investigation rather than verdicts: each has more than one possible explanation, and combinations matter more than single observations.
| Observation | Likely contributors | What to check next |
|---|---|---|
| Oxygen and moisture rise together while idle | Air ingress at a boundary | Glove ports, door seals, feedthroughs, KF joints |
| Moisture alone drifts upward | Wet glove, hygroscopic load, outgassing polymer | Recent transfers, glove age and material, newly installed components |
| Recovery slows after months of normal service | Reduced purification capacity or restricted flow | Regeneration history, loop flow, filter loading |
| Readings respond sluggishly to real events | Analyzer response, calibration drift, blocked sample filter | Calibration records, sample line, sensor cell flow |
| Fast rise with a long, flattening tail | Surface desorption from the load | Load drying, packaging, antechamber protocol |
When the pattern is still unclear, the information a supplier needs is the same information that resolves most internal investigations:
- Box configuration: number of glove ports and working sides, plus antechamber volume and how it is cycled.
- Working gas and control gas supply details, including purity and any drying upstream of the box.
- Purification system details: number of columns, when regeneration was last performed, and how the documented procedure was followed.
- Instrument details: sensor types, sample points, most recent calibration dates and the flow through the sample lines.
- Transfer data: typical load mass, material type, packaging, cycle counts and the interval between transfers.
- Any particle-control elements in the loop, including filter type, placement and service interval.
- The observed curve: baseline values, the size of the excursion and the time taken to return, logged as a trend rather than recalled from memory.
None of this requires a laboratory full of instrumentation. A logbook that records what went in, how it was transferred, what the readings did and when the loop was last regenerated will explain most slow recoveries within a few weeks. The value of a compact purification system is that it makes cause and effect visible: small volume, short loop, clear signal. The aim is to keep that signal honest by controlling the variables you can — dry loads, disciplined antechamber cycles, sealed packaging, maintained gloves and seals, calibrated analyzers, and a particulate filter that is serviced rather than ignored.